
I have been looking into developing a device to monitor a solar charging unit. This would be a remote sensor and relay the information back to a base to be presented on a user interface. There are a lot of elements to this type of project and one problem I have been thinking about was how to measure the voltage and current. Since most Microcontrollers have Analogue to Digital Conversion (ADC), I was originally thinking the measurement of voltage was not going to be a problem. But there are still a lot of things to think about when getting a measurement that is accurate and reliable over various load and temperature conditions. After seeing the YouTube video ” #321 7 Sensors tested: Measuring Current with Microcontrollers (Arduino, ESP32, ESP8266)” I became interested in the INA219 and thought to try it out.
Goal
The goal is to learn how the INA219 can be employed to monitor the voltage and current of a solar charging unit that will eventually be installed in a remote sensing unit. A couple of simple experiments will help to understand the interfacing, configuration and calibration of the device along with any issues and special considerations along the way.
To achieve this goal, some firmware will be required to communicate with the INA219. Normally, I would be using Atmel Studio 7. For this experiment, I will be trialing the MPLAB X Integrated Development Environment from Microchip.
Method
Equipment
- Adafruit INA219 Dev Board – Rshunt 0.1Ω 1% 2W
- Lab power supply – Adjusted to 14 volts and a maximum of 2 amperes.
- 5V Switching regulator
- Current Sink (Current Sink or Swim – CSoS project from Contextual Electronics)
- Breadboard
- Connector cables
- MCU (ATTiny 3217 Xplained-pro development board)
- USART to USB adapter
- 2 x voltmeters
- 1 x Analogue ammeter
Approach
Connection
The equipment listed was connected in the configuration shown in Diagram 1. The main devices to be connected were a Lab Power Supply (set to 14V and 2A), a MCU, the INA219 development board a Current Sink to simulate various loads on the system. A 5V regulator, powered by a 9V battery, was used to power the control circuitry of the Current Sink. The 9V battery was used as I did not want to introduce any additional load on the Lab Power Supply.
The MCU board was powered from a PC via the USB port that was used for programming and debugging.
To consider the eventual usage of the whole system a USART to USB adapter was connected to the MCU board to transfer the voltage and current readings to the PC. Finally, the INA219 was connected to the MCU TWI (IIC) interface.
One of the voltmeters was used to measure the Vbus (IN- to GND, range 20V), the other to measure Vshunt (IN+ to IN-, range 200mV) and the ammeter was used to measure the current flowing to the Current Sink, in this case, simply IN+ to GND, range 20V.

Calibration and Configuration
The configuration steps were taken from the INA219 datasheet using the values in Table 2 below. In summary, The conditions for the experiment will be: Maximum expected load current = 1.5 A, Nominal load = 1 A, VCM = 14V, Rshunt = 0.1mΩ, Vshunt Full Scale Range (FSR) = 320mV (PGA=/8) and Vbus Range (BRNG) = 0 (VBUS range = 16 V).


The Current Least Significant Bits (LSB) was calculated (Equation 1.) to be 0.061 mA/bit, rounded up to 0.1 mA/bit. The Calibration value (Equation 2.) came to 4096 (1000h).
| 15 | 14 | 13 | 12 | 11 | 10 | 9 | 8 | 7 | 6 | 5 | 4 | 3 | 2 | 1 | 0 |
| RST | – | BRNG | PG1 | PG0 | BADC4 | BADC3 | BADC2 | BADC1 | SADC4 | SADC3 | SADC2 | SADC1 | MODE3 | MODE2 | MODE1 |
| 0 | 0 | 0 | 1 | 1 | 0 | 0 | 1 | 1 | 0 | 0 | 1 | 1 | 1 | 1 | 1 |
| 16V | Div 8 | Shunt and bus continuous |
| Property | Value | Unit | Hex | Hex MSB First |
| Vcc | 3.3 | V | ||
| Vcm | 14 | V | ||
| BRNG | 16 | V | ||
| LSB | 0.004 | A/bit | ||
| Rshunt | 0.1 | Ohm | ||
| FSR Vshunt | 0.32 | V | ||
| Calibration | 1000 | |||
| Imax | 2 | A | ||
| Inom | 1 | A | ||
| Vshunt | 0.2 | V | ||
| Vdifferential | 0.1 | |||
| VIN+ | 14 | V | ||
| VIN- | 13.8 | V | ||
| Current_LSB | 0.061 | |||
| Rounded Current_LSB | 0.100 | |||
| Rshunt Pwr | 0.4 | 0.4 | ||
| Configuration | 00011001-10011111 | 199F | 9F19 | |
| Calibration | 4096 | 1000 | 0010 |
Firmware
The firmware went through several iterations before settling on the final version for this experiment. The iterations helped to work out the teething problems with communication with the TWI Bus and USART. The USART was used to communicate the values read from the INA219 to the PC. A pin interrupt was used on the User Push Button (SW300) to trigger when a reading was to take place. This also doubled as a reset button when held for more than three seconds.
The output was comma separated values (CSV) so that it could be easily read into a spreadsheet and graphed. In the dataset, a “reading number” or identifier and a timestamp were included. The timestamp was the number of seconds since the MCU was started or a Reset invoked. A reset could be invoked by holding the User Push Button for more than three seconds. Afterwhich the Reading Number and timestamp would be reset to zero.
reading, timestamp, Vshunt-raw, Vshunt, Vbus-raw, Vbus, current-raw, current, power-raw, power
1, 24, 0x000d, 0.130, 0x6d02, 13.952, 0x000d, 1.299, 0x0007, 14.000
2, 92, 0x045a, 11.139, 0x6c9a, 13.900, 0x03fd, 102.099, 0x02dc, 1464.000
Sample CSV output
Steps
- The Current Sink was set to minimal current load.
- The lab power supply was started to power the 5V regulator and the Current Sink.
- The USART to USB adapter was switched on
- The HTerm program was started and connected to the USART to USB adapter – Baud: 9600, Data: 8, Stop: 1, Parity: None
- The MCU board was powered on.
- The reading from the three meters was recorded and the User Push Button pressed (i.e. less than three seconds) to initiate a reading that was output to the HTerm Received Data area. The reading number was also recorded to associate the three voltmeters with the reading from the INA219.
- The Current Sink current load was increased so that the current reading on the lab power supply increased by 100 mA
- Steps 6 and 7 were repeated until the lab power supply reached 1.5 amperes.
- The data captured by the HTerm program was then saved off as a CSV file and imported into a spreadsheet where the data was then collated and graphed with the data captured from the meters.
Results
| Reading | Load Lab Supply | Load Analog | Read Vshunt | Read Vbus | Metered Vshunt | Metered Vbus |
| 1 | 2 | 0 | 0.149 | 13.952 | 0.1 | 13.90 |
| 2 | 120 | 100 | 12.269 | 13.888 | 12.4 | 13.83 |
| 3 | 214 | 200 | 22.529 | 13.836 | 22.1 | 13.79 |
| 4 | 317 | 300 | 32.719 | 13.788 | 32.8 | 13.73 |
| 5 | 415 | 400 | 44.079 | 13.736 | 42.9 | 13.68 |
| 6 | 510 | 500 | 52.879 | 13.684 | 52.8 | 13.63 |
| 7 | 607 | 600 | 62.919 | 13.612 | 62.9 | 13.56 |
| 8 | 707 | 700 | 73.250 | 13.592 | 73.1 | 13.52 |
| 9 | 802 | 800 | 83.769 | 13.548 | 83.3 | 13.50 |
| 10 | 904 | 900 | 94.829 | 13.500 | 94.1 | 13.44 |
| 11 | 995 | 1000 | 103.779 | 13.468 | 103.9 | 13.41 |
| 12 | 1082 | 1100 | 113.970 | 13.380 | 113.4 | 13.36 |
| 13 | 1192 | 1200 | 124.500 | 13.340 | 125.3 | 13.30 |
| 14 | 1287 | 1300 | 138.050 | 13.284 | 135.5 | 13.29 |
| 15 | 1399 | 1400 | 149.660 | 13.284 | 148.0 | 13.25 |
| 16 | 1505 | 1500 | 159.389 | 13.236 | 159.8 | 13.21 |

| Reading | Read Current | Read Power | Load Lab Supply | Load Analog |
| 1 | 1.200 | 16 | 2 | 0 |
| 2 | 123.800 | 1734 | 120 | 100 |
| 3 | 219.600 | 3040 | 214 | 200 |
| 4 | 330.700 | 4436 | 317 | 300 |
| 5 | 435.700 | 5896 | 415 | 400 |
| 6 | 524.900 | 7156 | 510 | 500 |
| 7 | 629.099 | 8608 | 607 | 600 |
| 8 | 735.400 | 9982 | 707 | 700 |
| 9 | 837.400 | 11344 | 802 | 800 |
| 10 | 946.000 | 12694 | 904 | 900 |
| 11 | 1050.199 | 14022 | 995 | 1000 |
| 12 | 1144.300 | 15184 | 1082 | 1100 |
| 13 | 1261.400 | 16834 | 1192 | 1200 |
| 14 | 1352.300 | 18312 | 1287 | 1300 |
| 15 | 1477.599 | 19592 | 1399 | 1400 |
| 16 | 1594.000 | 21094 | 1505 | 1500 |
Discussion
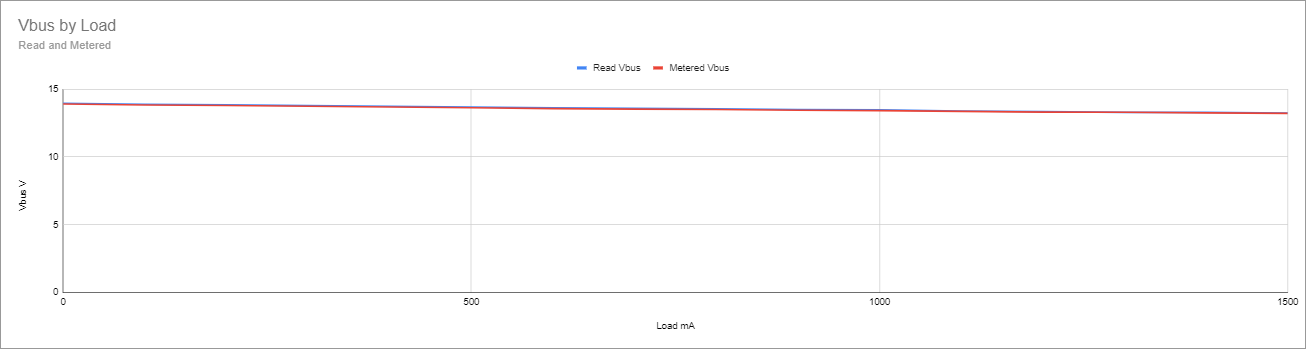
There were some teething problems with the connection of the system. These were worked through in association with the TI E2E Support Forum where the load ground was not directly connected back to the load supply. Once this issue was fixed, the values read back from the INA219 for the Vshunt and Vbus were very close to the values measured on the voltmeters.
I did have an issue where the Vbus was a lot higher than expected. I eventually found out that one of the multimeters used for measuring voltage is out by at least 8%. This caused some confusion in the results and the experiment needed to be repeated several times.
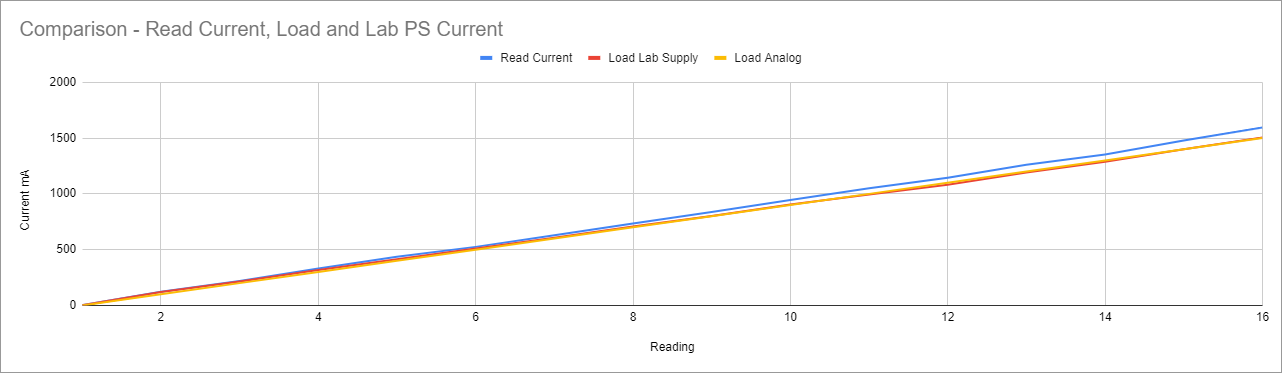
I had a further issue where It can be seen in Graph 3, for the current comparison, that the result read from the INA219 tends to move away from the measured value in an almost linear fashion. At first I thought this is related to other loads and errors in the system. I.e. The 5V regulator being supplied also by the lab power supply. The extra loads were removed by supplying the 5V regulator with a 9V battery, but still the trend persisted.
Finally, I introduced an ammeter into the configuration. Due to the resources available, a 30V 1.5A analogue meter was used. Once again, the results were consistent with previous readings. I then applied the formula for the Current Register based on the Vshunt and the calibration value. Here I found that the calculated value was consistent with the values read from the INA219.
Going back to the datasheet, the calculation for the Corrected Full Scale Calibration was applied

Equation 3.

= 3854 ⇒ 0F0Eh
The new calibration value was applied to the INA219 and the test procedure was executed. The results were much better and the current value read from the INA219 was in line with the expected results.
| Reading | Read Vshunt | Read Current | Read Power | Load Lab Supply | Load Analog | Current Register |
| 1 | 0.130 | 1.299 | 14 | 2 | 0 | 1.223 |
| 2 | 11.139 | 102.099 | 1464 | 105 | 100 | 104.809 |
| 3 | 21.189 | 205.699 | 2782 | 207 | 200 | 199.371 |
| 4 | 33.040 | 306.600 | 4200 | 314 | 300 | 310.879 |
| 5 | 41.629 | 393.799 | 5410 | 404 | 400 | 391.695 |
| 6 | 52.559 | 491.000 | 6724 | 507 | 500 | 494.537 |
| 7 | 61.639 | 579.799 | 7920 | 597 | 600 | 579.972 |
| 8 | 73.790 | 695.599 | 9450 | 707 | 700 | 694.303 |
| 9 | 84.729 | 798.299 | 10882 | 812 | 800 | 797.230 |
| 10 | 93.250 | 875.299 | 11894 | 892 | 900 | 877.406 |
| 11 | 105.250 | 986.799 | 13232 | 992 | 1000 | 990.316 |
| 12 | 113.599 | 1077.599 | 14428 | 1084 | 1100 | 1068.873 |
| 13 | 126.180 | 1172.599 | 15646 | 1184 | 1200 | 1187.250 |
| 14 | 136.660 | 1280.800 | 17178 | 1294 | 1300 | 1285.858 |
| 15 | 145.379 | 1395.000 | 18354 | 1397 | 1400 | 1367.897 |
| 16 | 162.089 | 1489.599 | 19586 | 1512 | 1500 | 1525.125 |

Conclusion
INA219
I had little doubt that the INA219 would be ideal for measuring the current and voltage in the intended system. Using a formal approach to testing and recording the results has helped to identify some areas to watch out for when using this device. Some of the things learned along the way include
- Ensure that the Ground paths are connected correctly to their respective power domains
- Relying on the base values for calibration from the calculations is not enough.
- The final system where the INA219 is implemented will need a means to apply the corrected calibration value.
It was interesting to use an analogue meter to set the current. I found that it was much simpler to set a respectable current level than using the digital display on the Lab Power Supply. Lining up the needle to the mark is much quicker than trying to chase numbers on a display.
MPLAB X IDE
The usage of the MPLAB X IDE did not feature much in this report. Overall it worked very well and the MPLAB Code Configurator (MCC) was useful in setting up the pin usage and generating some base code for TWI and USART. The MCC is somewhat similar to the Atmel Start configurator. One area that took some working out was the setting of the Fuse Bits. In Atmel Studio 7, this is a part of the programmer dialog. For MPLAB X, this is reached via the Windows -> Target Memory Views -> Configuration Bits
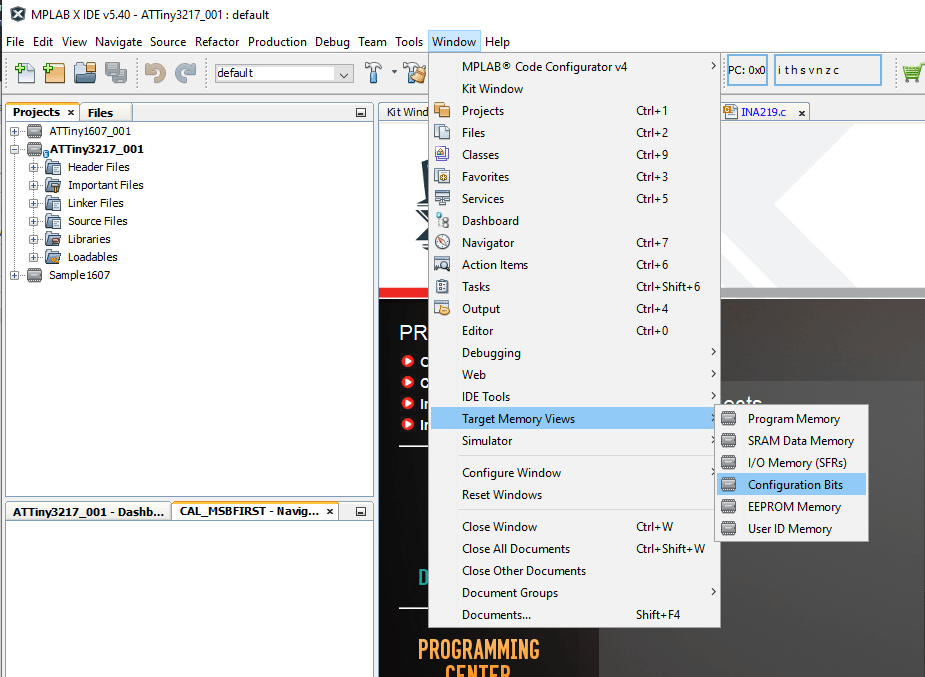
Before any changes are made, the values of the bits should be read from the device and then written back after changes. This is achieved via the respective buttons on the Configuration Bits window. Diagram 3 highlights these buttons.

References
#321 7 Sensors tested: Measuring Current with Microcontrollers (Arduino, ESP32, ESP8266)
Current Sink or Swim – CSoS project from Contextual Electronics

One thought on “Trying out the INA219”